Estimap
An interactive map of France merging 16 public real-estate data sources — sales records, cadastre, building registry, energy ratings, census, hazards, schools, transport — behind a price estimation engine.
- year
- 2025
- role
- Full-stack design and development
- status
- Completed
- front
- Nuxt 3, MapLibre GL
- back
- FastAPI, Celery
- data
- PostGIS, Redis
Context
The problem
French real-estate data is public and free. It is also scattered: transactions sit in the DVF sales register, parcel geometry in the cadastre, building characteristics in the BDNB registry, energy performance in the DPE dataset, demographics at INSEE, hazard exposure somewhere else again — and plenty more: local amenities, transport, fibre coverage, schools, building permits, condominiums.
Each has its own format, its own granularity and its own pivot identifier. Cross-referencing "the price per square metre of houses built before 1975 with an F or G energy rating in a flood-prone area" therefore takes a considerable amount of upfront merging.
The product goal
A property price estimation engine — the map is the exploration surface, but the point is to feed a model with genuinely cross-referenced features.
Phase 1 (weighted kNN comparables, progressive radii, plausibility guards) is in production and answers 100% of estimation requests today. Phase 2 (LightGBM, 27 features) is in final training before promotion, behind an automatic gate that compares any new model against the one currently served.
Architecture
- Frontend: Nuxt 3 + MapLibre GL, PMTiles — map, property sheet, back office
- Backend: FastAPI + SQLAlchemy, with Celery for long-running work
- Data: PostgreSQL / PostGIS for the spatial layer, Redis as broker and cache
- Infra: docker-compose, workers split by queue
Workers are split across two queues: imports for source ingestion, and
mutations for rebuilds, enrichment, tile generation and model training. That
separation keeps a multi-hour import from blocking a tile rebuild that takes a
few minutes.
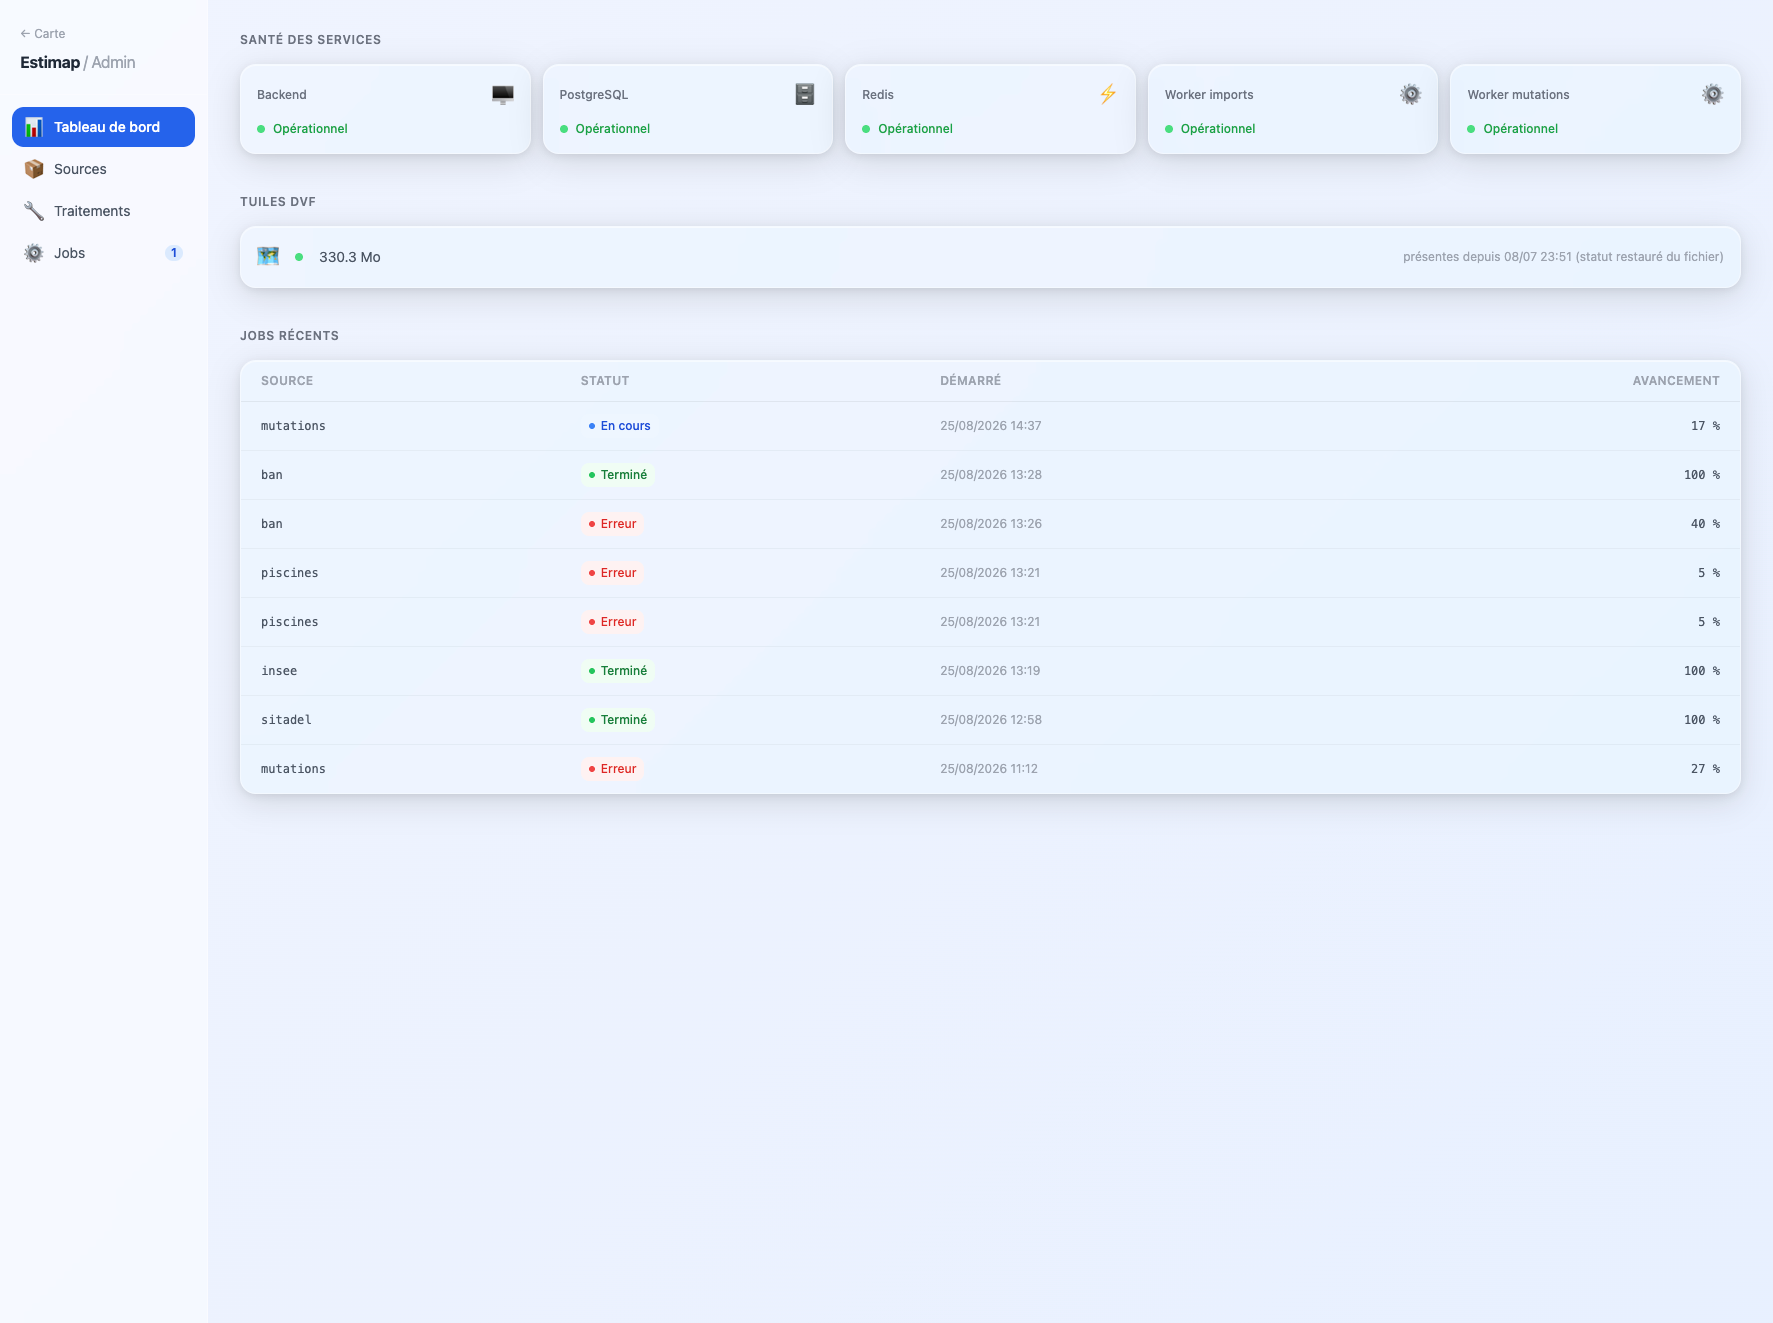
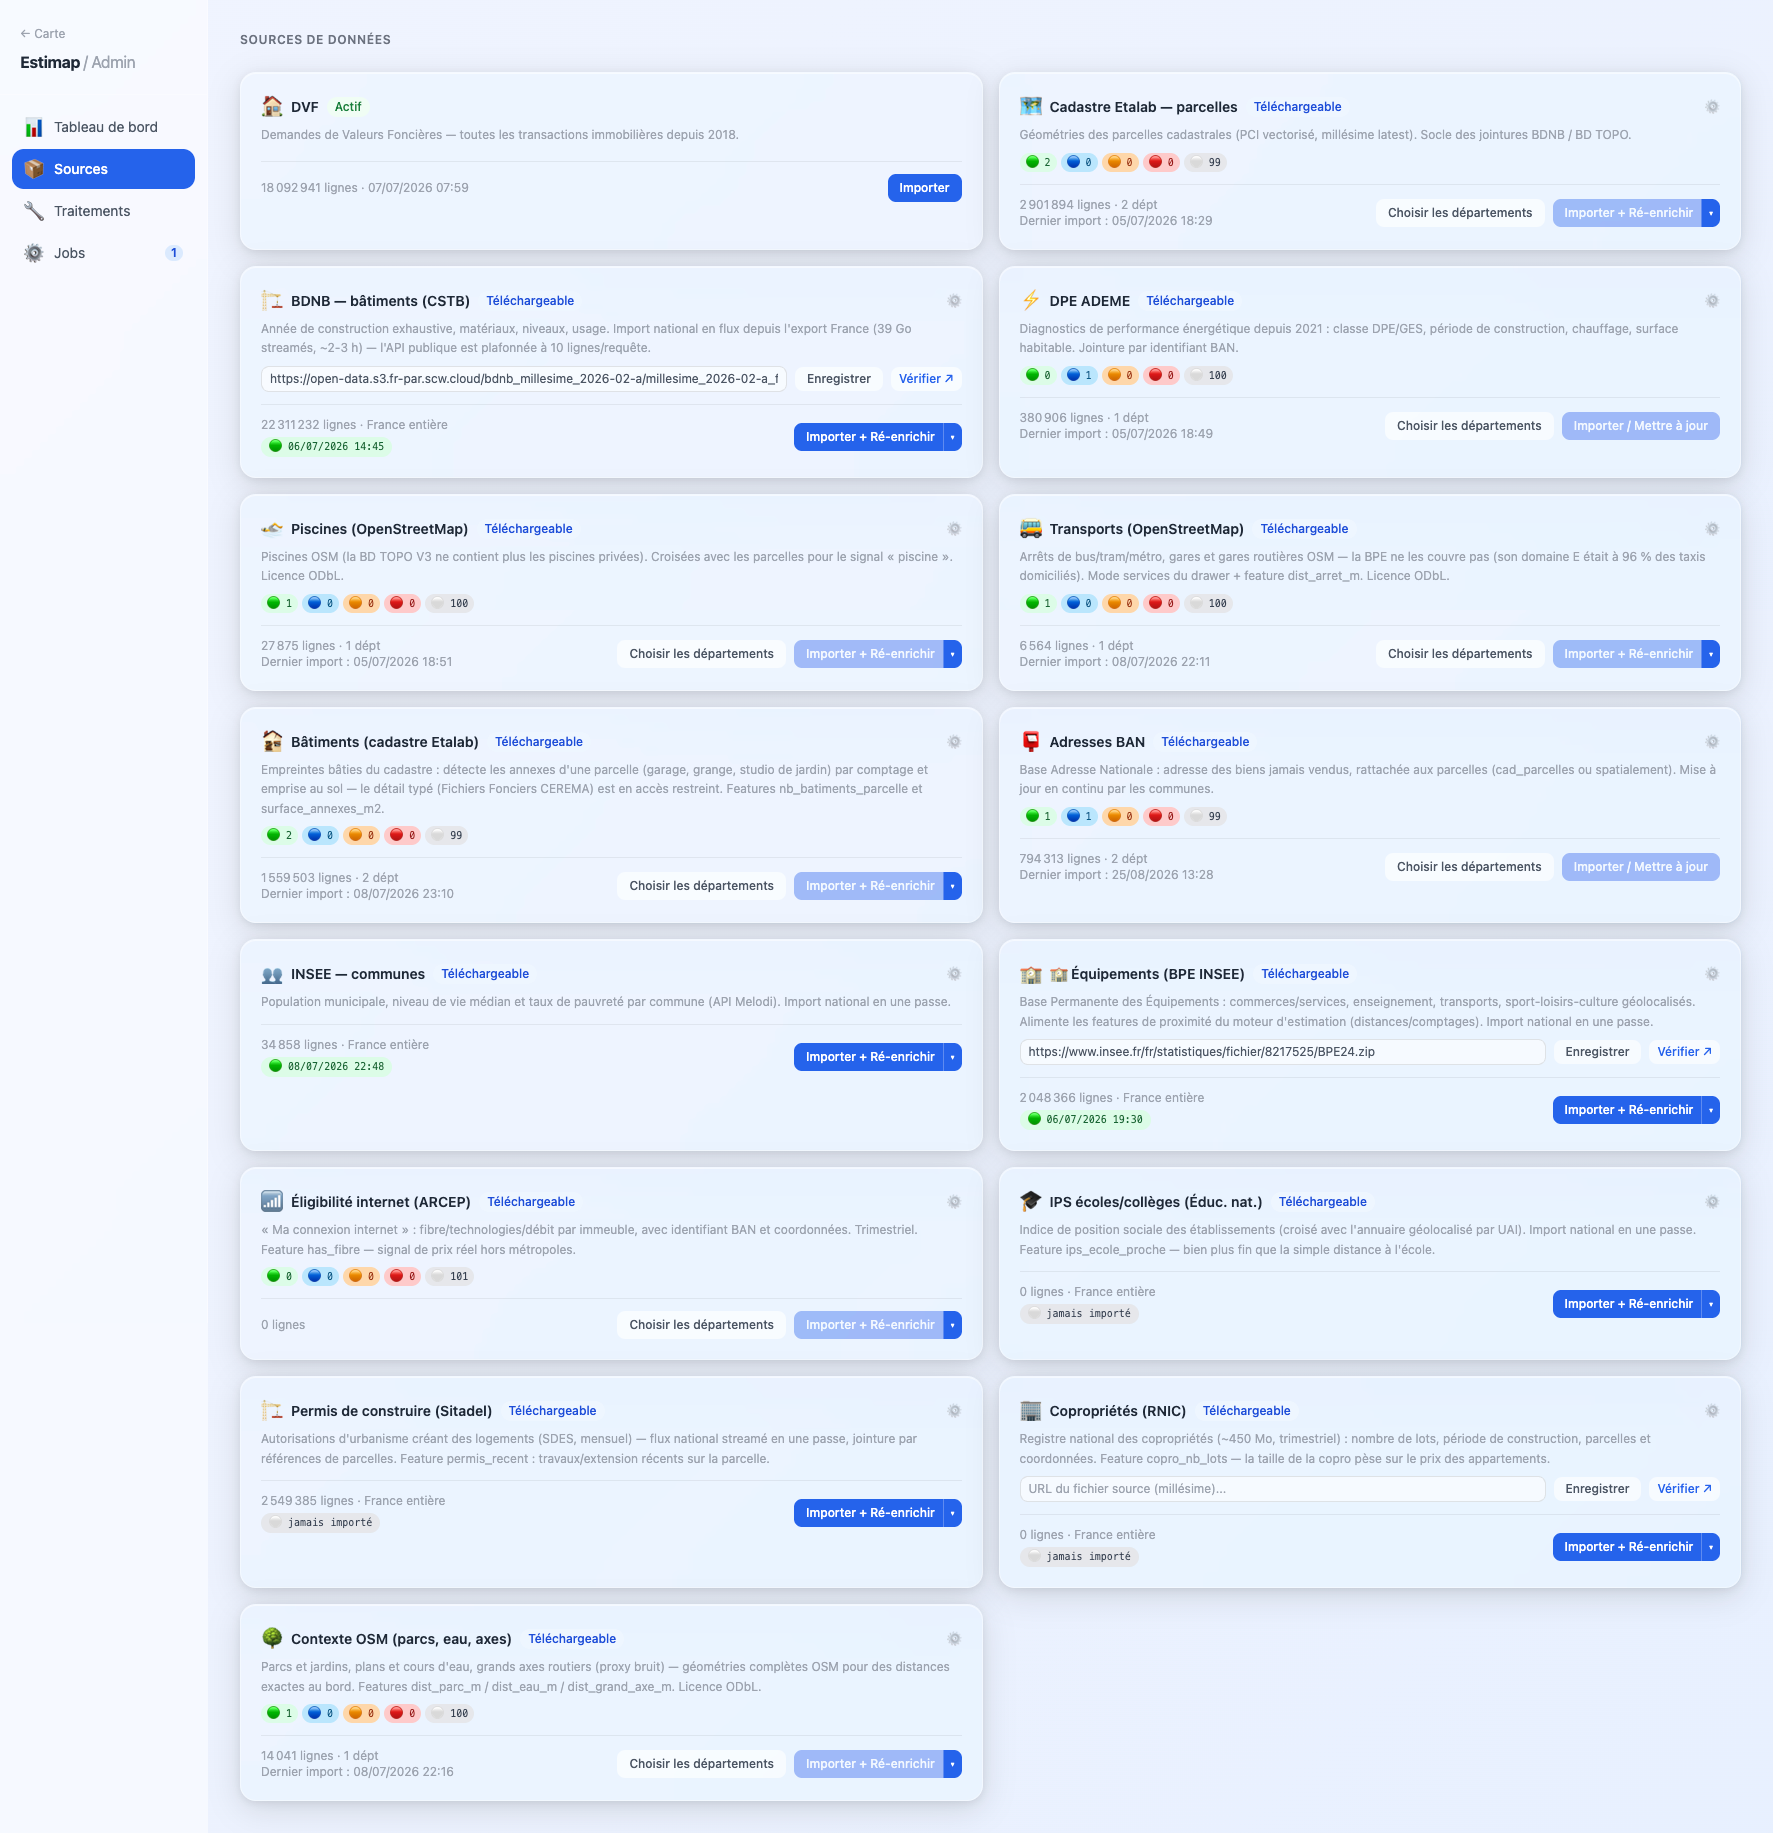
An /admin back office drives 15 source connectors and tracks import state.
What the map covers
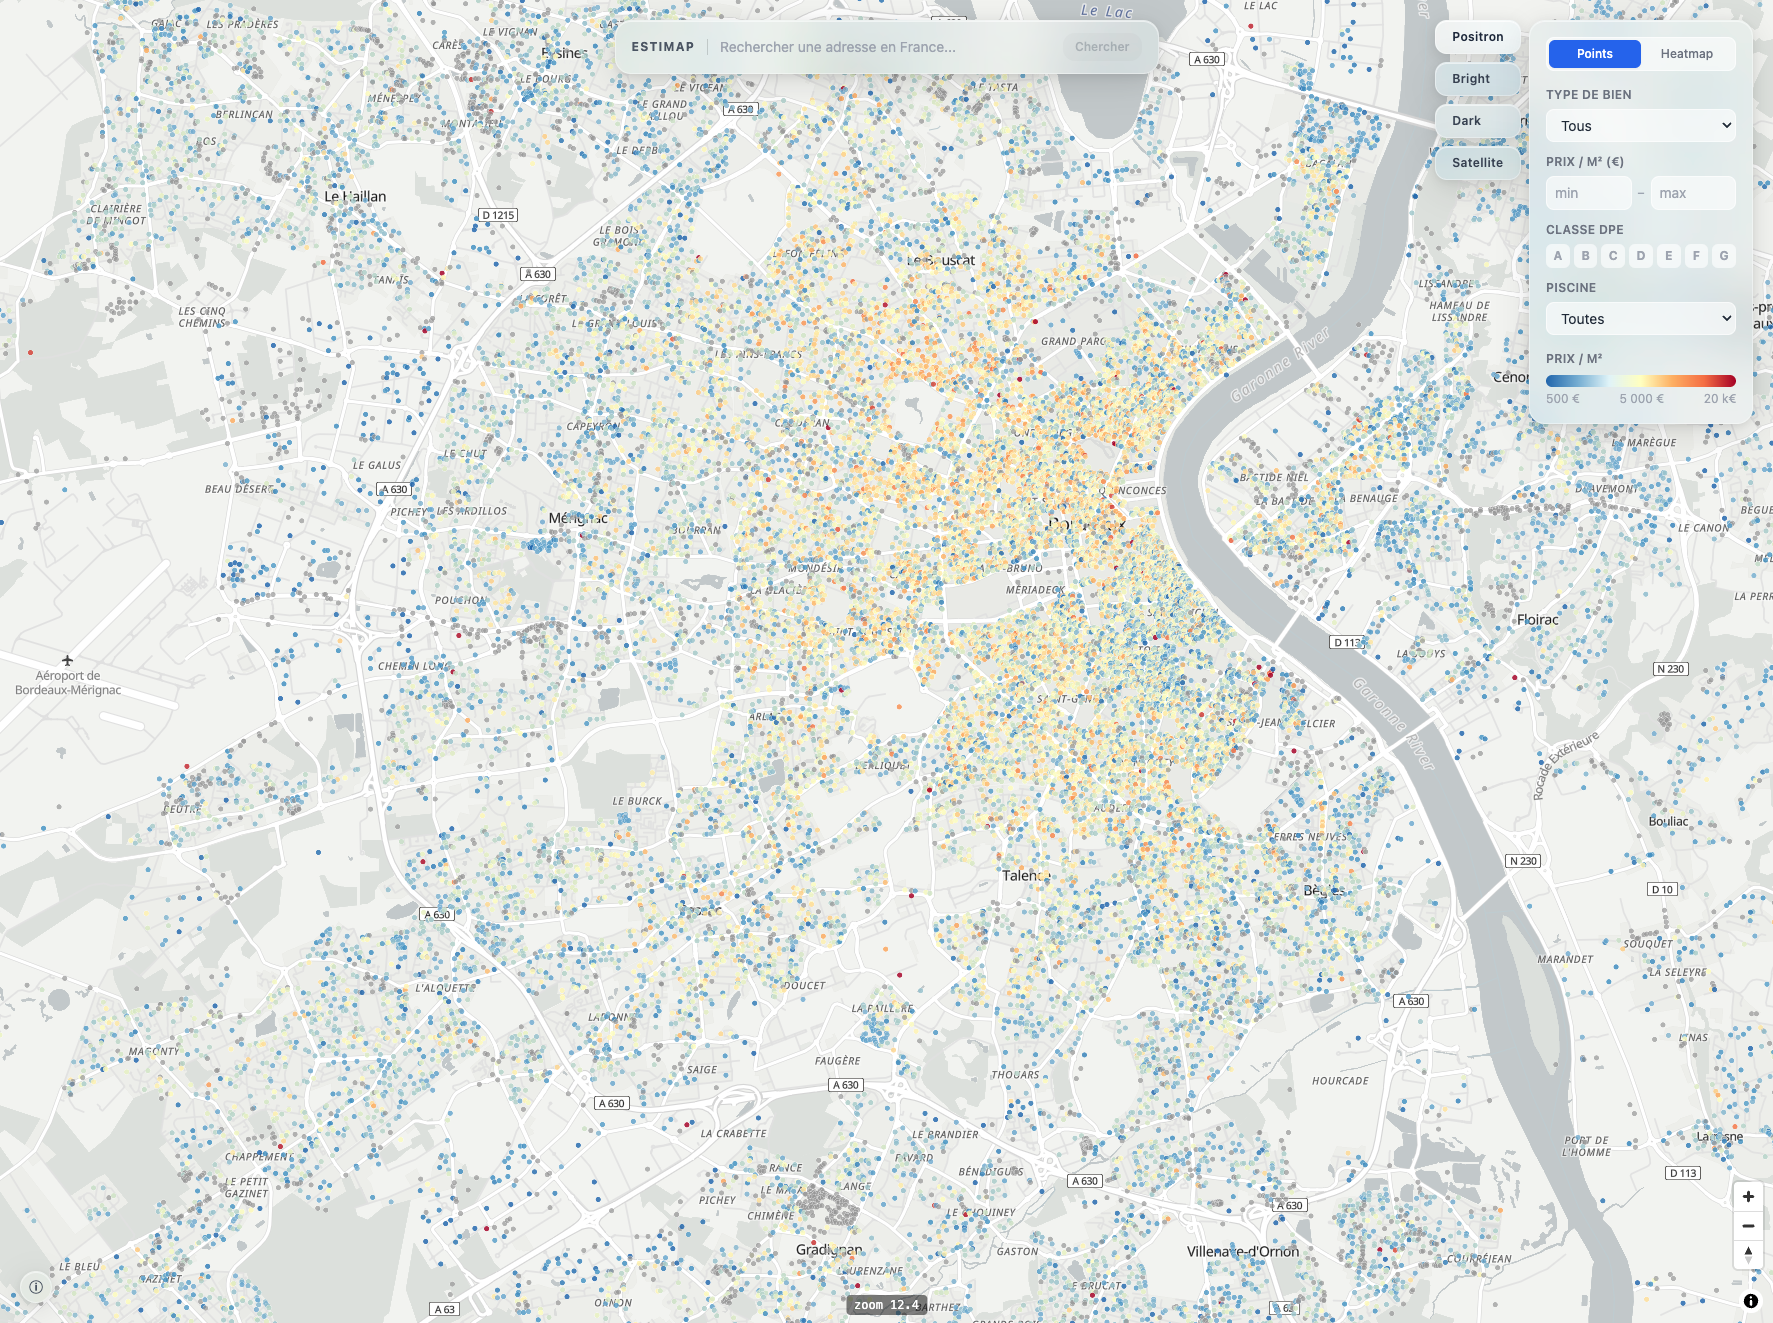
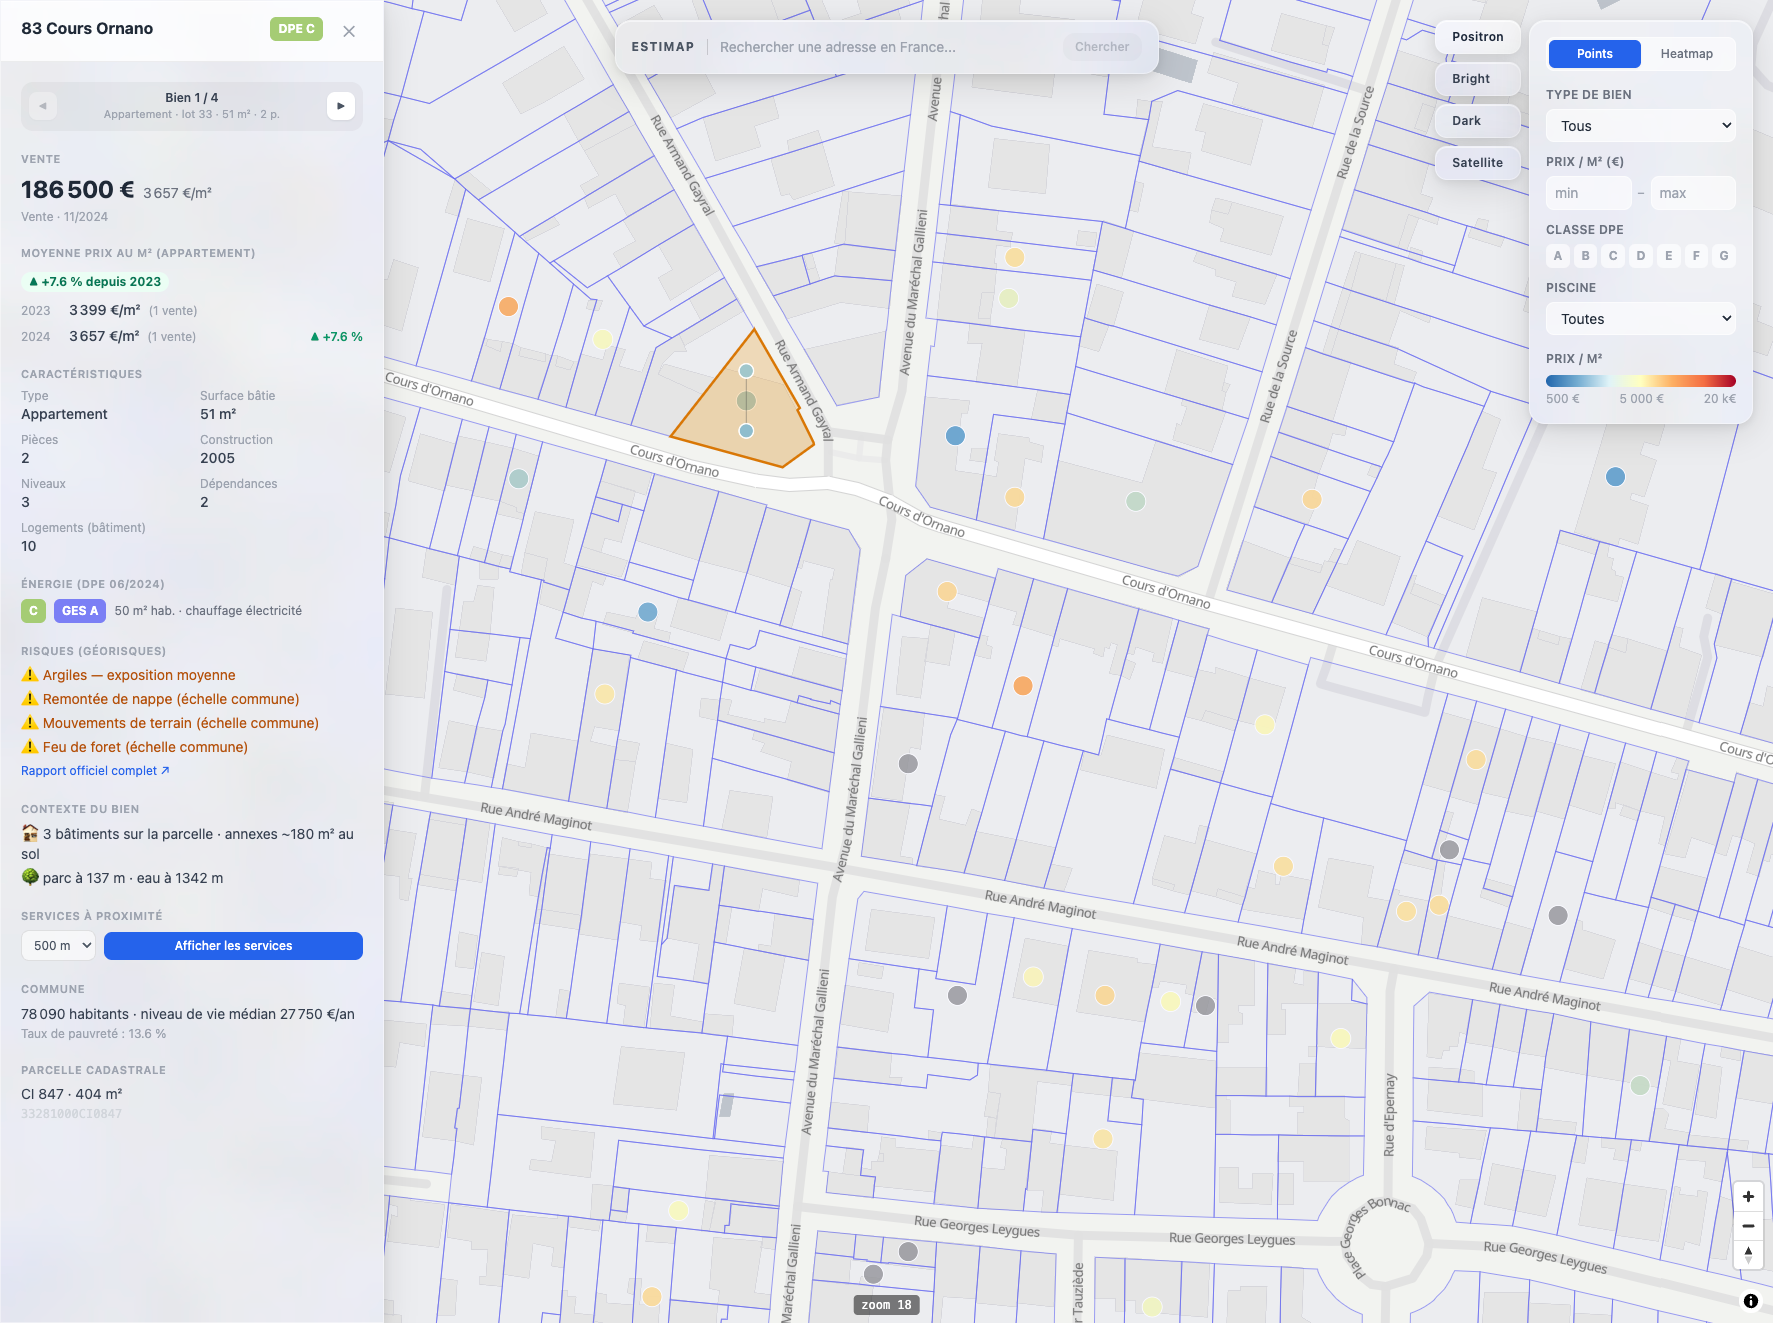
Around 7 million property sales (18M raw rows in the sales register) shown as points coloured by price per square metre or as a heatmap, filterable by type, price, energy rating and pool. A click opens the property sheet: sale history, extended energy rating, building context (outbuildings, fibre, school with its social index, condominium, recent permits, parks, water, noise), live regulatory hazards, and nearby amenities that can be layered onto the map.
Method
The project rests on documentation in ten files — architecture, sources, data model, pipelines, API, frontend, back office, runbook, roadmap — kept current with every significant change. The runbook in particular records the infrastructure traps learned the hard way, which saves relearning them.
What I took away
On this kind of project the difficulty is never the algorithm: it's reconciling identifiers across registries that were never designed to talk to each other. A cadastral parcel and a building record share no key — it has to be rebuilt spatially, and you have to accept an imperfect match rate. And a quality metric (a backtest median absolute percentage error, say) is only worth what its protocol is worth: a temporal leak between comparables and the tested sale skewed the headline number for a long time.
Architecture
01 · Frontend
Nuxt 3 + MapLibre GL (PMTiles) — map, property sheet, back office.
02 · Backend
FastAPI + SQLAlchemy, Celery for long-running work, two separate queues (imports/mutations).
03 · Data
PostgreSQL / PostGIS (~100M rows) for the spatial layer, Redis as broker and cache.
04 · Infra
Docker Compose, workers split by queue.
Interface
Next project
Globe Satellites