Pyro Radar
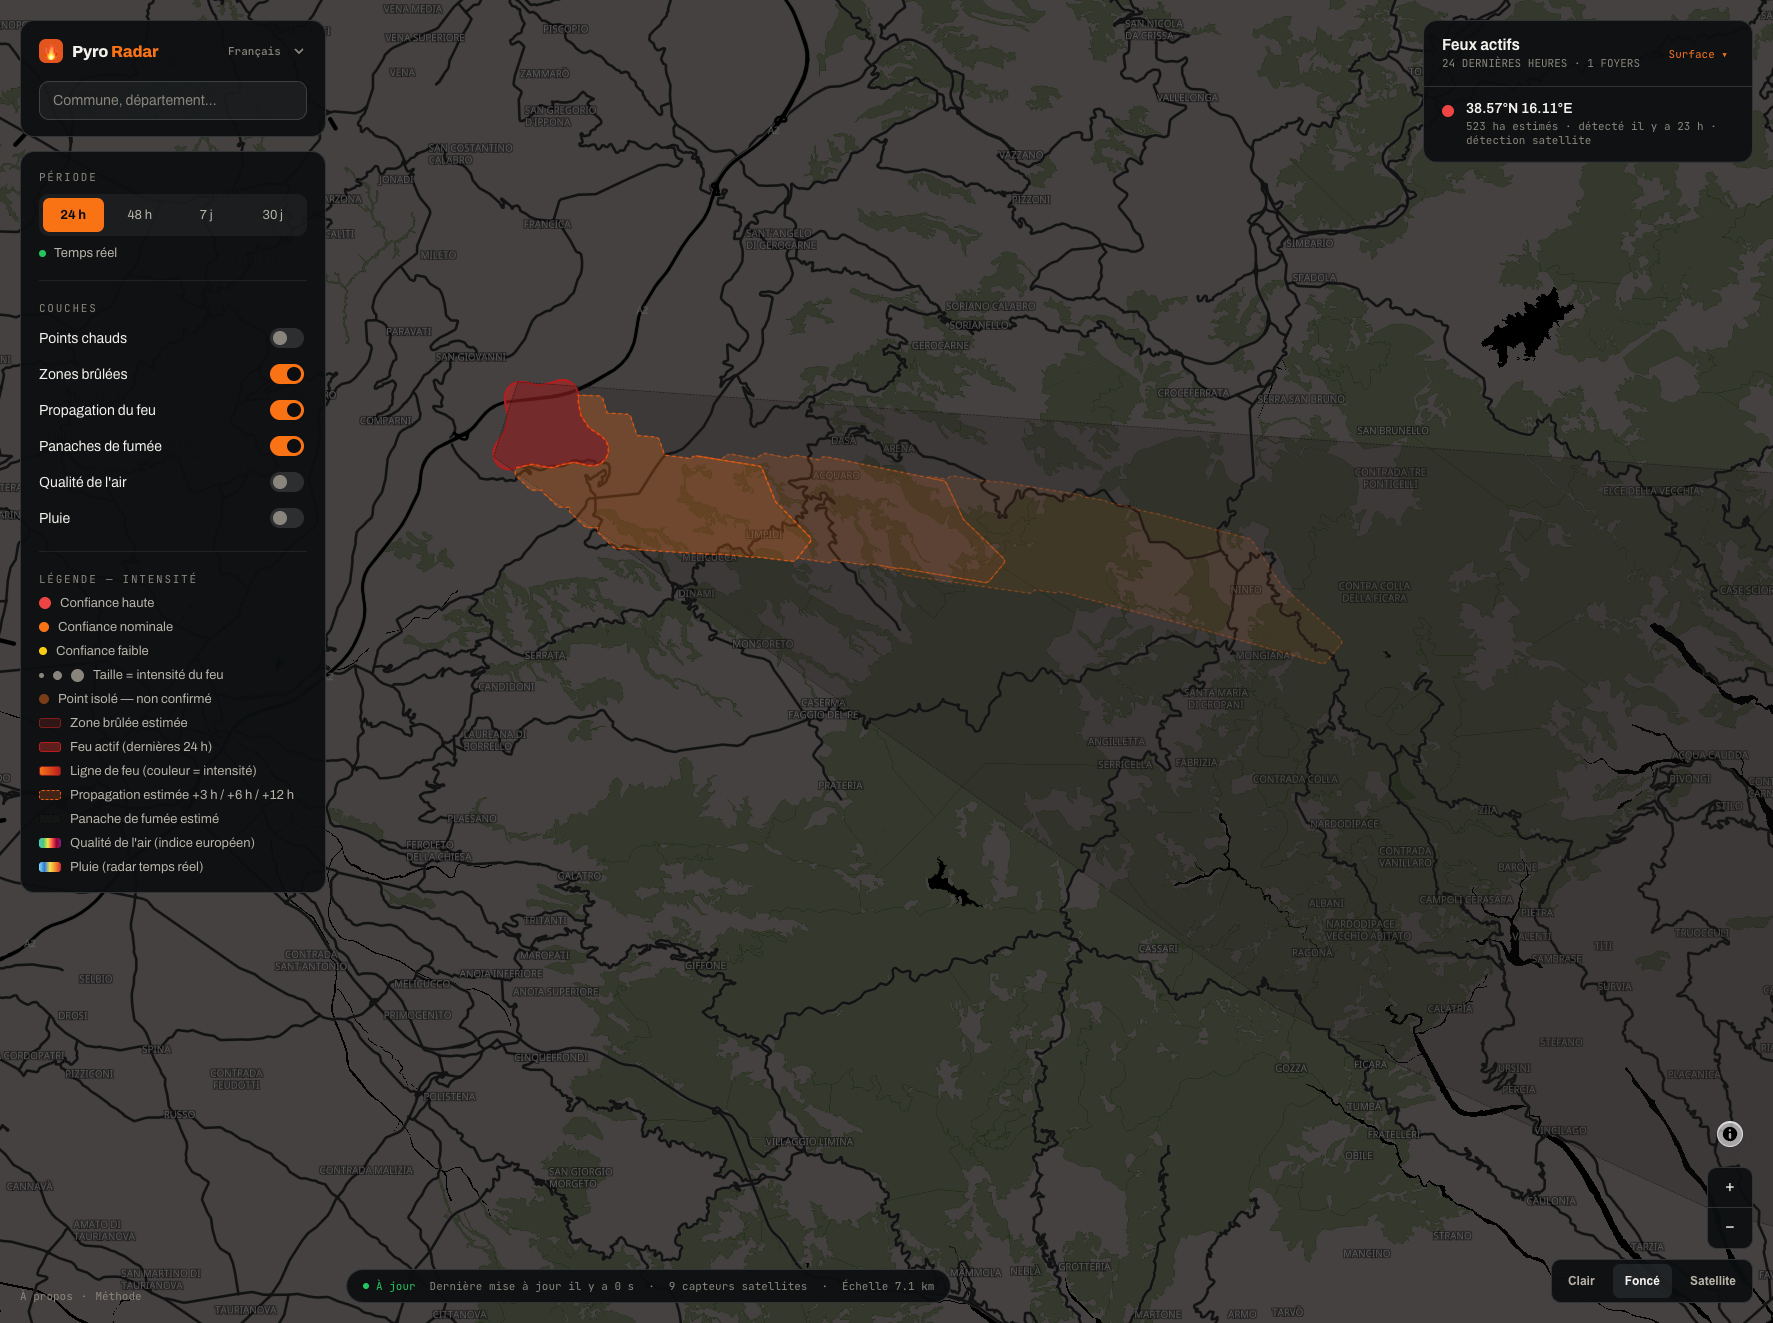
Real-time wildfire tracking worldwide, built from six satellite sources aggregated onto a single vector map.
- year
- 2026
- role
- Full-stack design and development
- status
- Live
- front
- Vue 3, MapLibre GL
- back
- AdonisJS, SSE
- data
- PostGIS, PostgreSQL
Context
The idea
Fire detection data is public, free and abundant — NASA, ESA, NOAA and JAXA broadcast it continuously. It also comes in heterogeneous formats, at different cadences, with geographic coverage that only partly overlaps.
Pyro Radar merges those feeds into a single worldwide map, refreshed continuously.
The sources
| Source | Coverage | Cadence |
|---|---|---|
| NASA FIRMS (VIIRS / MODIS) | Worldwide | Orbital passes |
| GOES-18 / 19 | Americas | 10 min |
| Meteosat MTG (LSA SAF) | Europe / Africa | 10 min |
| Himawari-9 | Asia / Oceania | 10 min |
| Sentinel-3 SLSTR (Copernicus) | Worldwide | Orbital passes |
Geostationary satellites bring the frequency, polar orbits bring the resolution.
The technical work
Ingestion. CSV for FIRMS, NetCDF for GOES, HDF5 for MTG: one ingester per source normalises into a shared schema of geolocated detections.
Burned areas. Point detections become estimated polygons directly in PostGIS, in batches — loading every zone at once was taking Postgres down.
Wind. GFS data is only decoded around active fires. The worldwide grid would have weighed several gigabytes per cycle for information that only matters over a few dozen square kilometres.
Real time. Server-Sent Events: no polling, and no bidirectional WebSocket where a one-way stream is enough.
Mapping. MapLibre GL, OpenFreeMap basemap and Esri satellite view — no API key, so no quota and no surprise bill.
What I took away
Adding a coverage area is one line of SQL. That design constraint, set early, kept the geographic logic from scattering across the application code.
Architecture
01 · Sources
Six satellite feeds aggregated — NASA FIRMS, GOES-18/19, Meteosat MTG, Himawari-9, Sentinel-3.
02 · Ingestion
One ingester per source (CSV, NetCDF, HDF5) normalises into a shared schema of geolocated detections.
03 · Storage
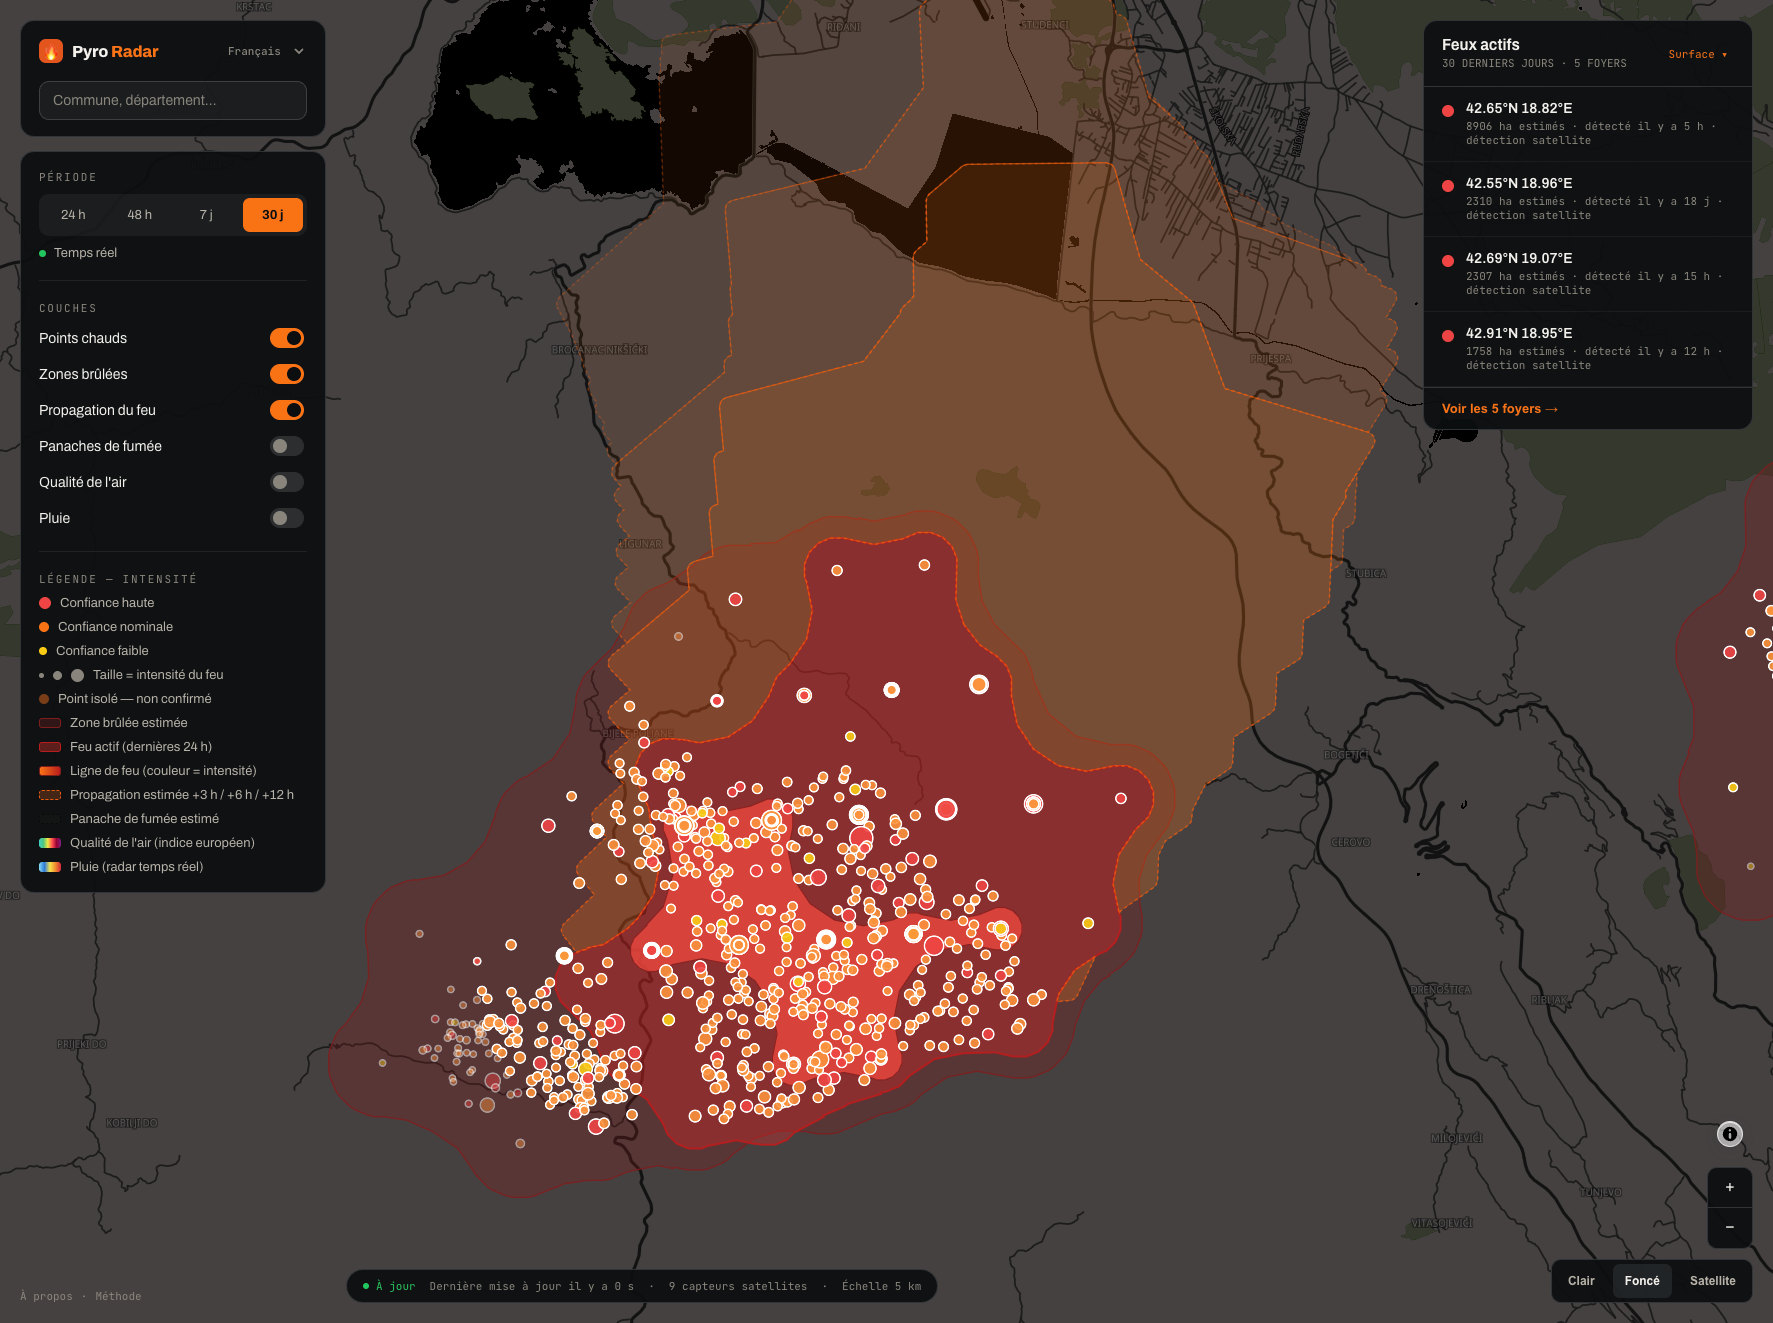
Burned areas estimated as polygons directly in PostGIS, in batches.
04 · Rendering
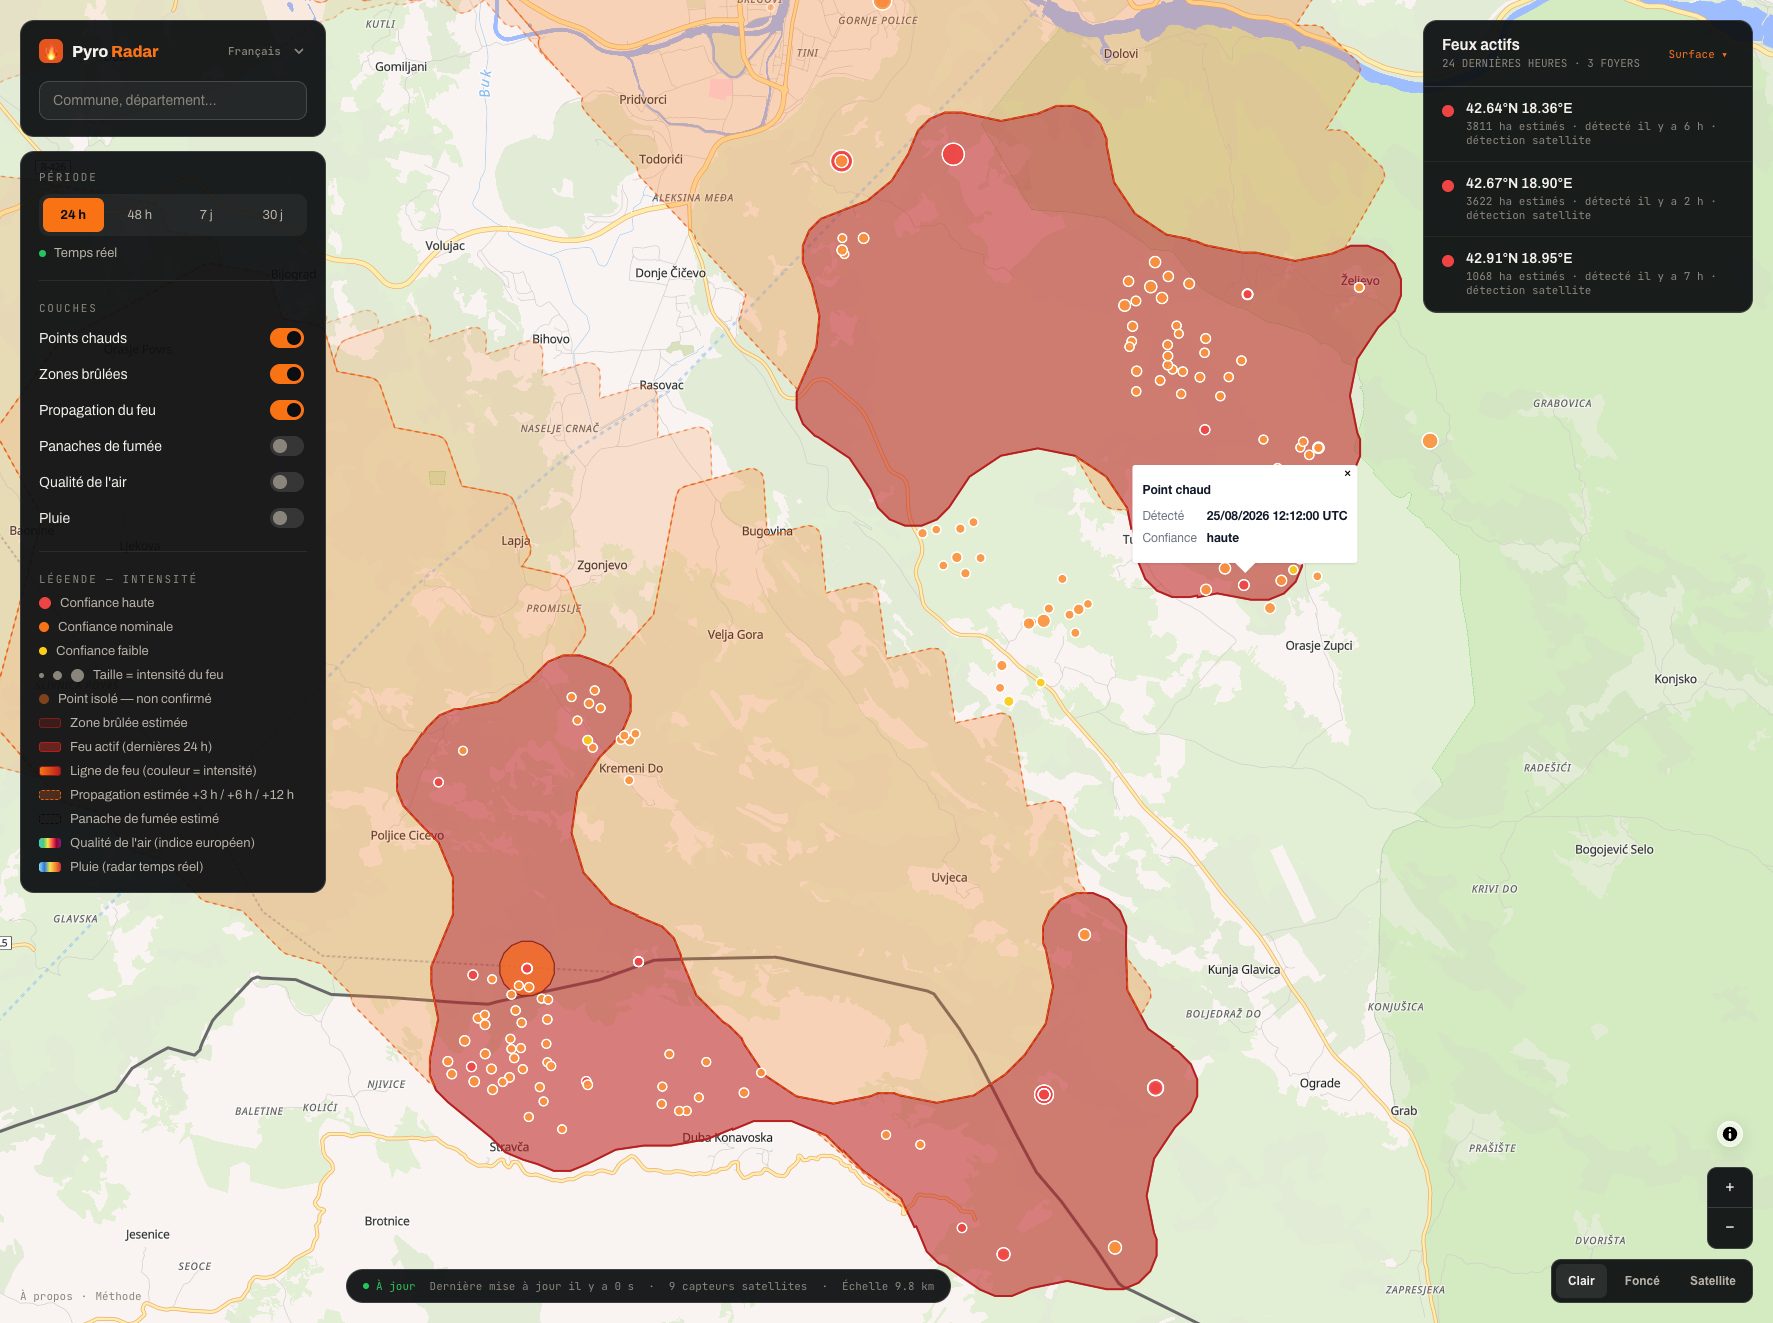
MapLibre GL vector tiles, real-time delivery over Server-Sent Events.
Interface
Next project
Estimap